


Have you ever noticed how some businesses always seem one step ahead — predicting customer needs, fixing issues instantly, and making data-backed decisions effortlessly? The secret behind that precision is something called Operational Analytics.
Table of Contents
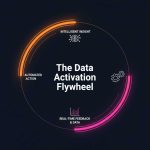
Operational Analytics is the process of embedding real-time data insights into everyday business operations. Instead of relying on monthly reports or static dashboards, it helps teams act instantly — whether it’s optimizing a marketing campaign, improving sales performance, or enhancing customer support.
By integrating AI in analytics, businesses can now move from passive data collection to proactive, automated decision-making. In this guide, we’ll explore what operational analytics really means, with real-world examples, use cases, and key benefits that show how it’s transforming modern organizations.
The Breaking Point: Why Your Dashboards Are Failing You
For years, the BI dashboard has been the holy grail of the data-driven company. The promise was simple: visualize your data, unlock its secrets. But a critical, costly flaw has emerged in this model: dashboards are fundamentally backward-looking. They are brilliant at telling you what happened last quarter, but they are powerless to change it.
Imagine you’re a marketing leader. You open your dashboard on Monday and see a spike in customer churn that occurred on Thursday. The insight is there, but it’s far too late. The customers are gone. In this scenario, the dashboard has become a data morgue—a place to perform autopsies on problems you can no longer fix. This “insight latency” is a silent killer of growth in a world that demands instant responses.
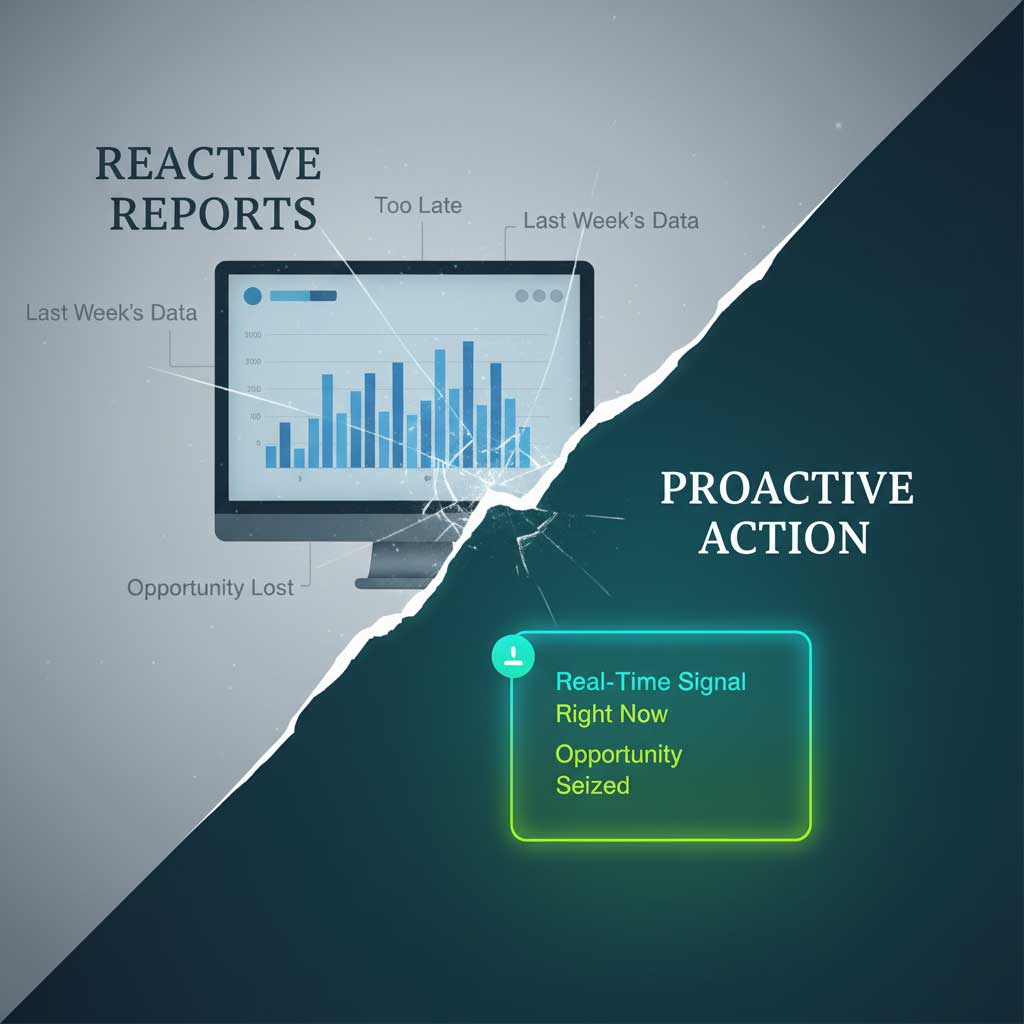
This isn’t an inconvenience; it’s a competitive disadvantage. Relying on a weekly report in today’s economy is like navigating a Formula 1 race with a folded paper map. You need a GPS, and that GPS is operational analytics.
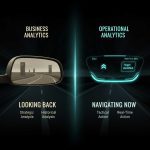
A Tale of Two Analytics: Operational vs. Strategic (BI)
One of the most common mistakes is trying to use strategic BI tools for operational tasks. It’s like using a telescope to read the menu in front of you. To succeed, you must understand the deep, philosophical difference in the operational analytics vs business analytics debate. It’s not about which is “better”; it’s about using the right tool for the right job.
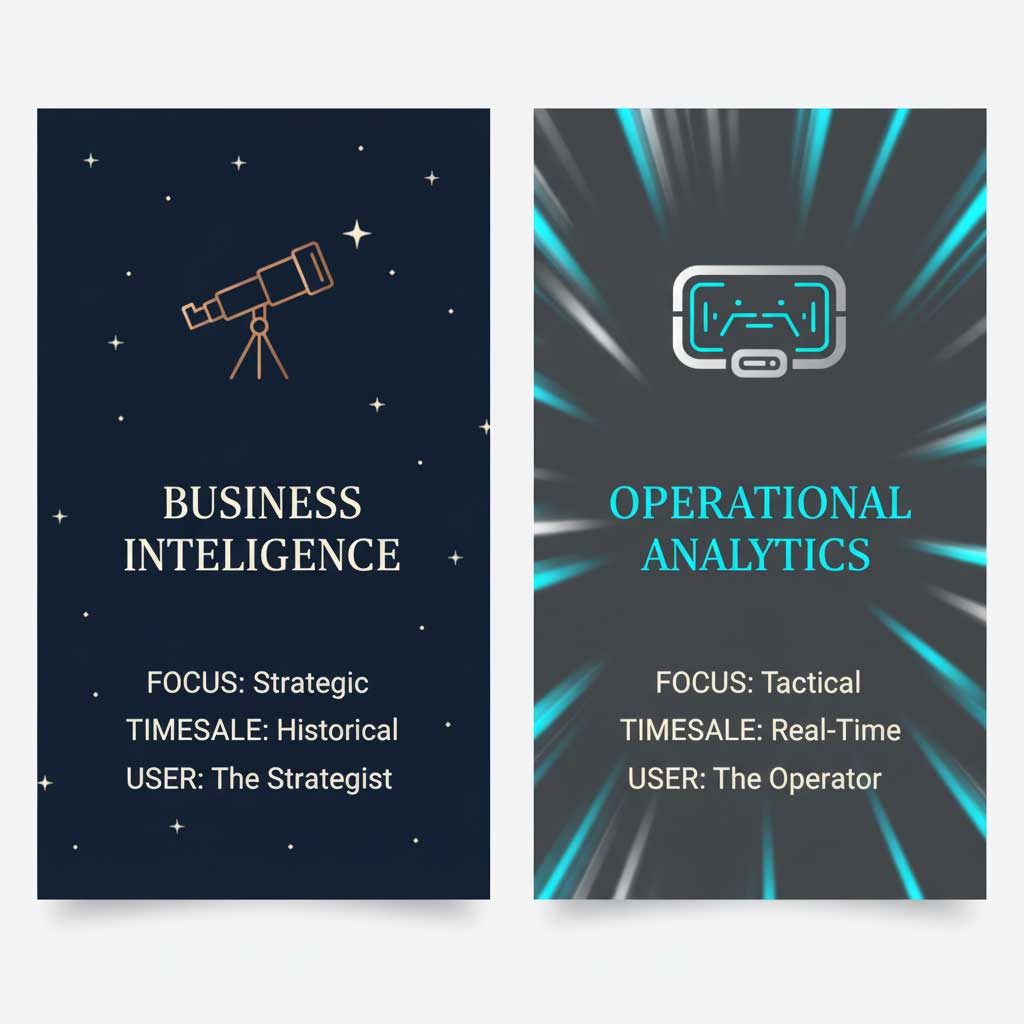
Strategic Business Intelligence (BI) is your road atlas. It helps you plan a long-term journey by aggregating historical data to answer big-picture questions for leadership. Operational analytics, on the other hand, is your real-time GPS. It uses live, event-level data to help your frontline teams navigate the immediate, turn-by-turn decisions of their daily work.
The distinction in operational analytics vs business analytics is crucial because it affects the data, the users, the speed, and the entire culture of how you use data.
| Feature | Operational Analytics | Business Analytics (Strategic BI) |
| Primary Goal | Action – To drive and automate immediate, in-the-moment decisions. | Strategy – To inform and guide long-term corporate planning. |
| Core Philosophy | Empower the frontline. Embed intelligence into daily workflows. | Report to leadership. Analyze historical trends for strategic shifts. |
| Users | Frontline Employees (Marketers, Sales, Support), Automated Systems | C-Suite Executives, Data Analysts, Department Heads |
| Data Speed | Real-Time, Streaming Data (Seconds to Minutes) | Historical, Aggregated Data (Hours, Days, Weeks) |
| Key Question | “What should we do right now for this customer?” | “What were our overall results last quarter, and what are the trends?” |
| Example | Automatically syncing a “High Churn Risk” tag to a user’s profile in the CRM to trigger a proactive support call. | Creating a quarterly business review (QBR) deck analyzing regional sales performance against a forecast. |
The Engine Room: Key Trends and Technologies Powering Operational Analytics
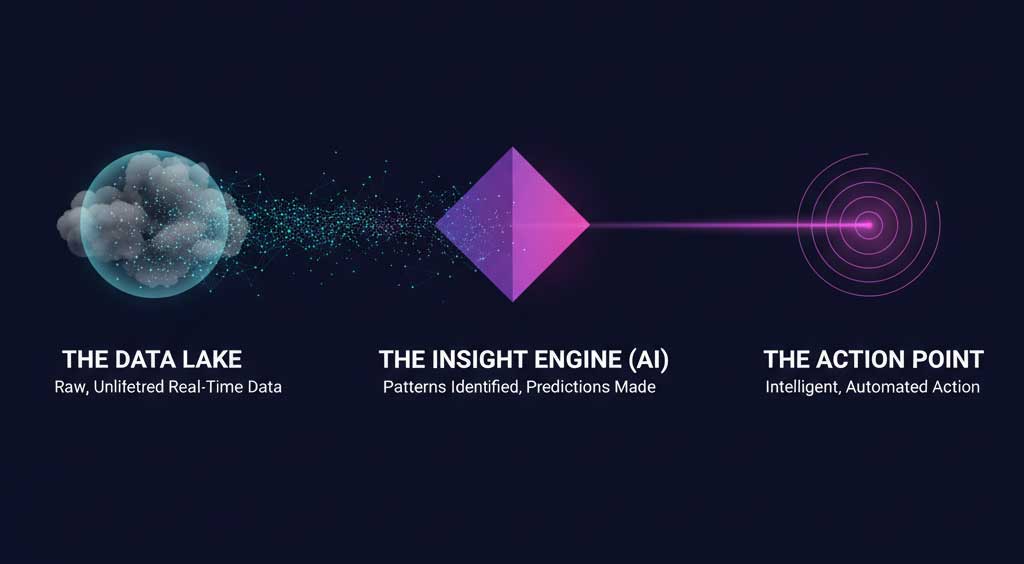
The rise of operational analytics is the result of a powerful convergence of cloud technologies that make processing and activating data faster and more accessible than ever. This is the “architecture of action.”
The Foundation: The Cloud Data Warehouse
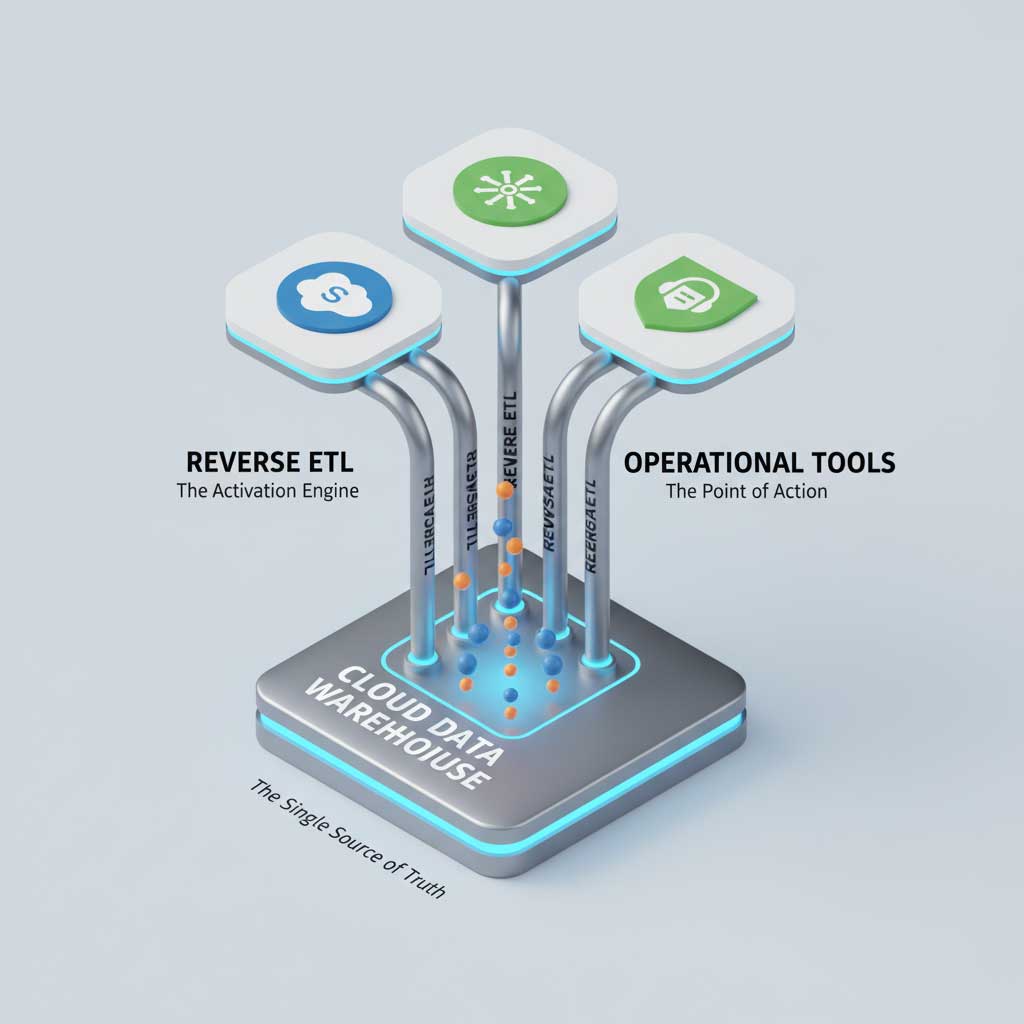
The heart of this architecture is the cloud data warehouse (e.g., Snowflake, Google BigQuery). Unlike rigid, on-premise warehouses of the past, these platforms are elastic and scalable, serving as the “single source of truth” where all your customer data is cleaned, consolidated, and modeled. This is the non-negotiable bedrock of any serious operational data analytics initiative.
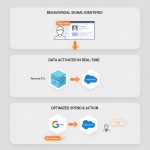
The Game-Changer: Reverse ETL and the Rise of Data Activation
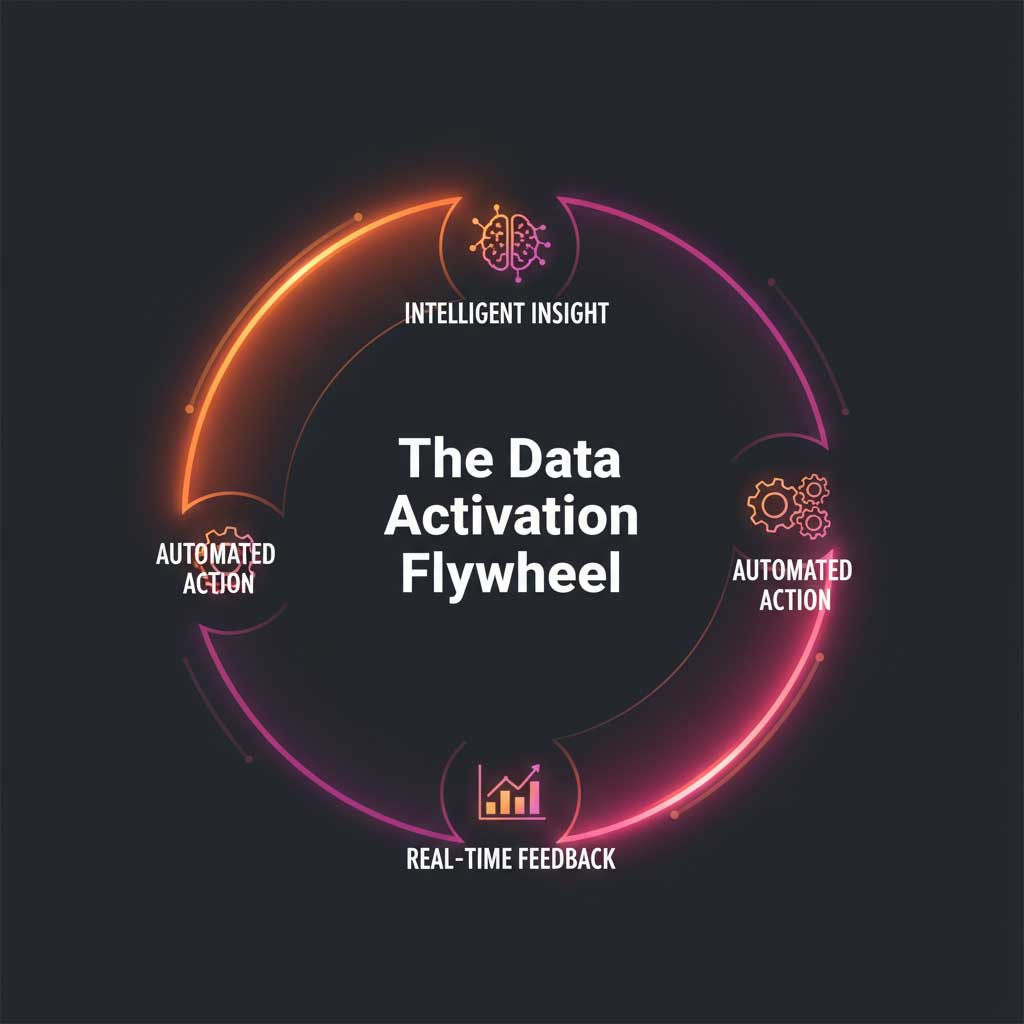
If the warehouse is the brain, then Reverse ETL is the central nervous system. This is the revolutionary technology making operational analytics a practical reality. For years, data flowed one way: into the warehouse. Reverse ETL flips this flow.
Platforms like Census and Hightouch allow you to take trusted data and models from your warehouse (e.g., a calculated LTV score) and sync them back out to the hundreds of tools your teams use every day—Salesforce, HubSpot, Google Ads, and more. This is “Data Activation,” the process of turning insights into action, and it’s the core function of operational analytics.

The Intelligence Layer: AI and Machine Learning in Action
This is where the stack becomes truly intelligent. The powerful AI in analytics models are developed on top of the clean data in the warehouse, and their outputs are then operationalized via Reverse ETL.
Predictive Operational Analytics
This is the ability to forecast immediate outcomes. A classic example is a predictive lead scoring model that analyzes thousands of behavioral signals to calculate the real-time probability a lead will convert. This score is then synced to the CRM, allowing sales reps to focus their time on the leads that actually matter. This is predictive operational analytics in action.
Prescriptive Intelligence
Taking it a step further, prescriptive analytics recommends the “next best action.” For instance, if the system predicts a customer is at high risk of churning, a prescriptive engine might recommend automatically enrolling them in a targeted re-engagement email sequence.
The New Frontier: Generative AI
The latest evolution, driven by generative AI for marketing data analysis, is even more exciting. Imagine an AI agent that not only identifies a segment of high-value users but also drafts the personalized email campaign for them, suggests an A/B test, and, upon approval, executes the entire campaign.
Unlocking Value: Real-World Use Cases and Measurable ROI
Let’s move from the technical to the tangible. How does this operational data analytics stack actually create business value? The applications are nearly limitless, but they generally fall into enhancing customer experience and empowering the teams that serve them.
For the Growth-Obsessed Marketer
For marketers, operational analytics is the key to unlocking true one-to-one personalization and capital efficiency.
- Intelligent Audience Suppression: Stop wasting money showing acquisition ads to your existing customers. By syncing a real-time list of all active users from your warehouse to your ad platforms, you ensure your budget is spent only on acquiring new customers.
- Value-Based Bidding: Sync each user’s predicted Lifetime Value (LTV) from your warehouse into Google Ads. This allows you to use value-based bidding, telling Google to bid more aggressively for traffic that is likely to become a high-value customer.
- Hyper-Personalized Nurture Campaigns: Instead of generic email drips, create dynamic campaigns based on real-time user behavior. Did a user just interact with a specific feature? Trigger an email that provides advanced tips for that exact feature.
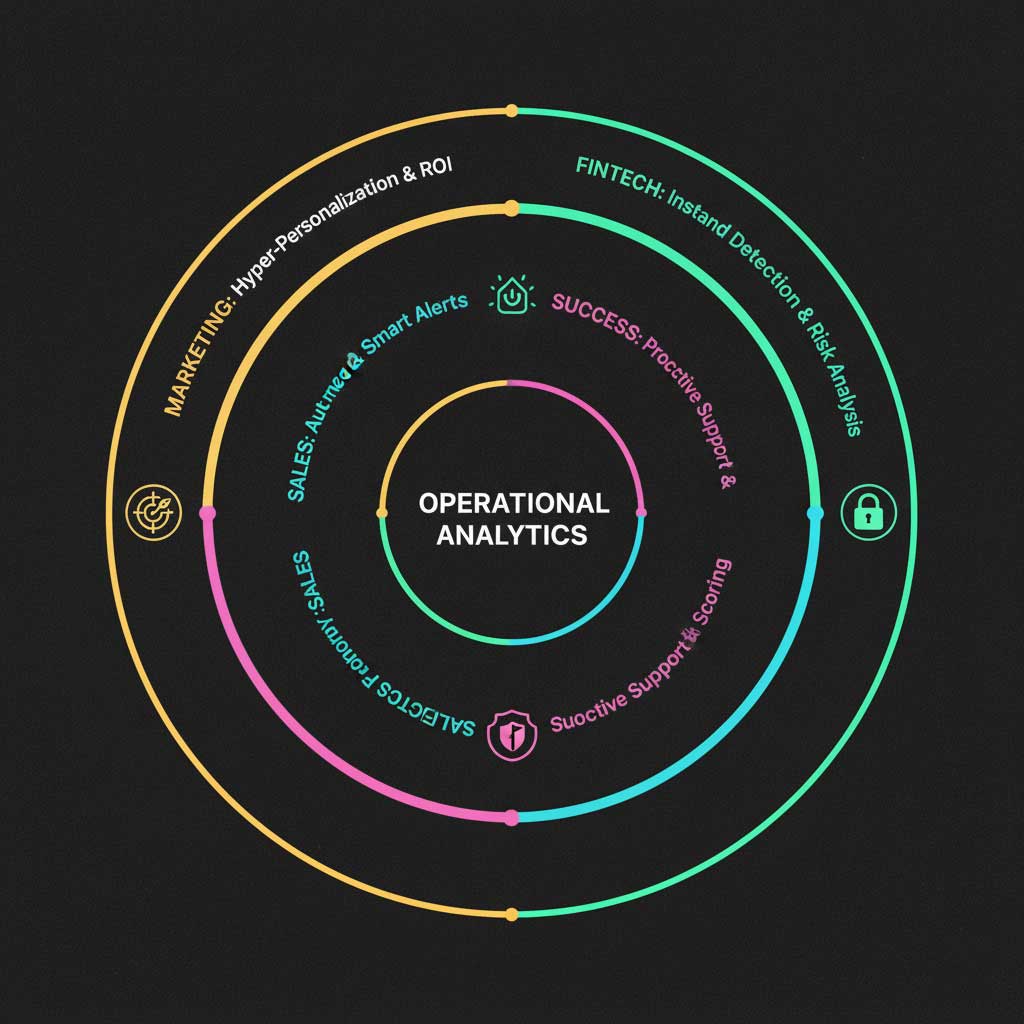
For the Product-Led Sales Team
In a Product-Led Growth (PLG) model, the sales team’s job is to intelligently engage with users who have already found value. Operational analytics is the engine that identifies these moments.
- Automated Product-Qualified Leads (PQLs): Define what a “hand-raiser” looks like in your product (e.g., a free user who just invited their 5th teammate). When a user meets these criteria, automatically create an opportunity in Salesforce and alert the right sales rep with all the context they need.
- Usage-Based Triggers for Sales Outreach: Alert a sales rep in Slack when an account’s usage is nearing its plan limit. These are the “buy me” signals that are invisible without real-time analytics.
For the Proactive Customer Success Manager
The best customer support is proactive, not reactive. Operational analytics allows your success team to solve problems before the customer even knows they have one.
- Real-Time Customer Health Scoring: Develop a dynamic health score in your data warehouse based on product usage and support history. If an account’s score drops, automatically create a task in the CSM’s workflow to investigate.
- Proactive Onboarding and Education: Identify users who are struggling with your product. Automatically enroll them in a helpful onboarding sequence or alert a support specialist to reach out.
For the Agile FinTech Innovator
When people ask, “how can banks use operational analytics?”, the answer is everywhere. From security to customer service, the impact is transformative.
- Real-Time Fraud Detection: Analyze transaction streams in milliseconds, comparing them against historical patterns to block malicious activity before the transaction is finalized.
- Instantaneous Risk Assessment: Power instant loan approvals by feeding dozens of real-time data points into a credit risk model, providing a better customer experience and more accurate underwriting.
The Modern Operational Analytics Stack: A Tech Comparison
Implementing operational analytics requires a set of modern, interconnected tools. No single tool does it all; instead, best-in-class platforms are chosen for each layer of the process. Understanding these operational analytics tools is essential.
| Tool Category | Purpose | Example Tools | Key Feature |
| Data Warehouse | The central source of truth for all business data. | Snowflake, Google BigQuery, Redshift | Scalability and separation of storage/compute. |
| Data Activation (Reverse ETL) | Syncs insights from the warehouse to business tools. | Census, Hightouch, RudderStack | Pre-built integrations with hundreds of SaaS apps. |
| Product Analytics | Understands user behavior within a product or website. | Amplitude, Mixpanel, Heap | Funnel analysis, retention charts, and user segmentation. |
| Business Intelligence | For strategic reporting and dashboarding (works with the warehouse). | Tableau, Looker (Google), Power BI | Advanced data visualization and dashboarding. |
The Practitioner’s Guide: From Strategy to Execution
Embracing operational analytics is a journey. From my experience helping companies navigate this shift, success is less about a “big bang” implementation and more about a phased, value-driven approach to data-driven decision-making.
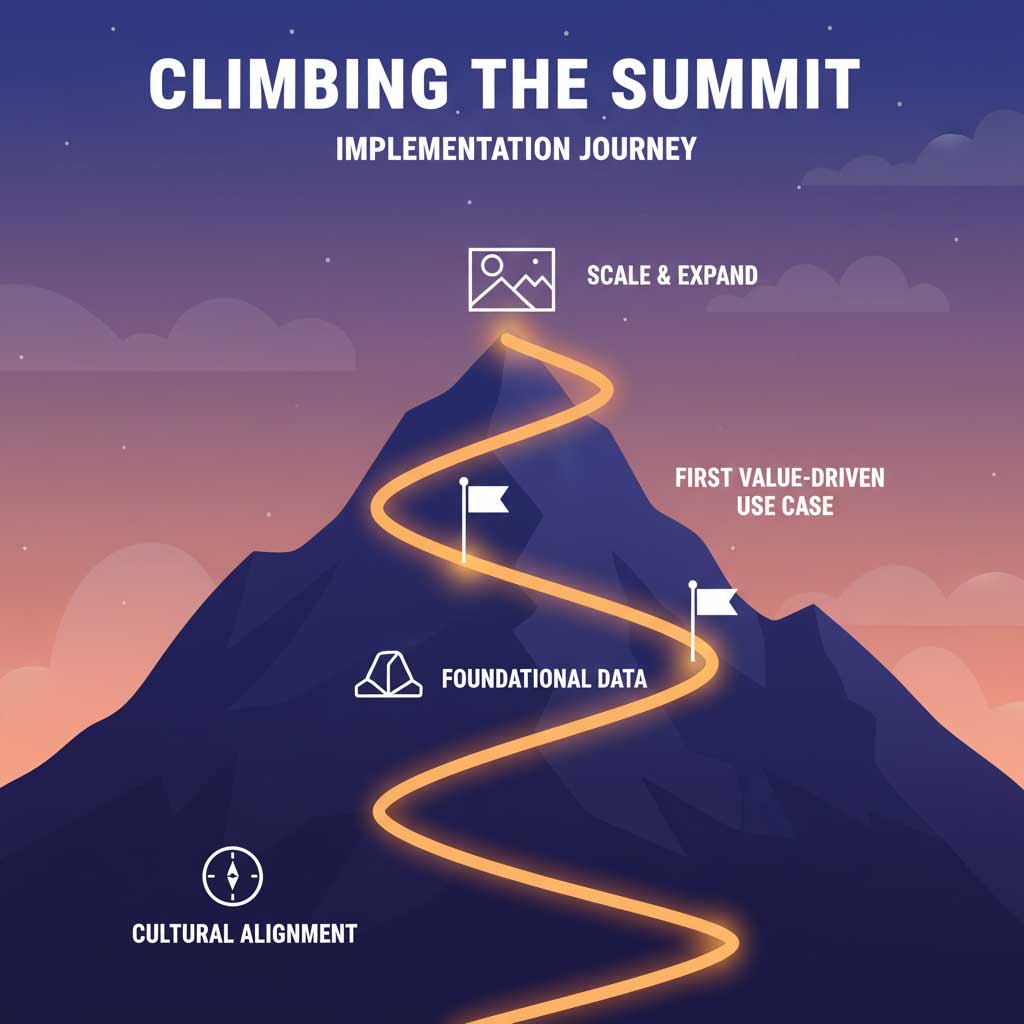
The Implementation Roadmap: A Phased Approach
- Phase 0: Cultural Alignment. Before you write a single line of code, get buy-in. Gather your marketing, sales, product, and data leaders. The goal is to shift the company mindset from “data for reporting” to “data for action.”
- Phase 1: Build the Foundation. Consolidate your core customer data into a cloud data warehouse. This is the most critical and often the longest phase. Don’t take shortcuts.
- Phase 2: Your First Activation Use Case. Don’t try to boil the ocean. Pick one high-impact, measurable problem, like suppressing existing customers from acquisition ad campaigns. It’s easy to measure and demonstrates clear value.
- Phase 3: Scale and Expand. Once you have a win, use that momentum. Systematically identify the next biggest “insight-to-action” gap in your business and apply the same framework.
Common Pitfalls and How to Avoid Them
This journey is not without its challenges. Here are the most common traps to avoid:
- The “Garbage In, Garbage Out” Problem: You cannot build an action-oriented data stack on a foundation of poor-quality data. Invest heavily in data governance from day one.
- Solving a Technology Problem, Not a Business Problem: Don’t buy a shiny new tool just because it’s trendy. Start with a clear business pain point and work backward to the technology that solves it.
- The Siloed “Data Team” Mindset: Operational analytics is a team sport. It requires deep collaboration between data engineers, analysts, and frontline business users. If your data team is treated like a service desk for running reports, this initiative will fail.
Is Operations Analytics a Good Career?
With the enterprise-wide shift towards data-driven decision-making, the demand for professionals who can bridge the gap between data and action has exploded. So, is operations analytics a good career? The answer is a resounding yes. Roles like Analytics Engineer, Data Activation Specialist, and Marketing Operations leader are in high demand, command competitive salaries, and play a pivotal role in connecting data to revenue.
Summary & Key Takeaways
The old paradigm of making decisions based on static, historical reports is giving way to a new model: a dynamic, intelligent, and automated enterprise. Operational analytics is the operating system for this new era.
By moving beyond strategic dashboards and embedding actionable insights directly into daily workflows, companies can create hyper-personalized customer experiences and build more efficient processes. The journey requires a commitment to a modern data culture and the right technology stack, but the payoff is immense. It’s the difference between looking in the rearview mirror and having a clear, intelligent view of the road ahead.
Frequently Asked Questions (FAQs)
Which best describes operational analytics?

The best description is the practice of activating data from your data warehouse by syncing it into frontline business tools (like CRMs) to drive immediate, automated actions and empower real-time decision-making.
What is the difference between business analytics and operational analytics?
The core difference is purpose and speed. Business analytics uses historical data for strategic planning (the “road atlas”). Operational analytics uses real-time data for tactical, in-the-moment actions (the “GPS”).
What is a real-world example of operational analytics in marketing?
A powerful example is syncing a “predicted LTV” score from your data warehouse to Google Ads. This allows you to automatically bid more for ad clicks from users who look like your future best customers, optimizing your ad spend for long-term value.
What is Reverse ETL and why is it important for operational analytics?

Reverse ETL is the technology that copies data from your central data warehouse back into your operational applications. It’s the critical “last mile” that closes the loop between data insight and business action, making it the engine of operational analytics.
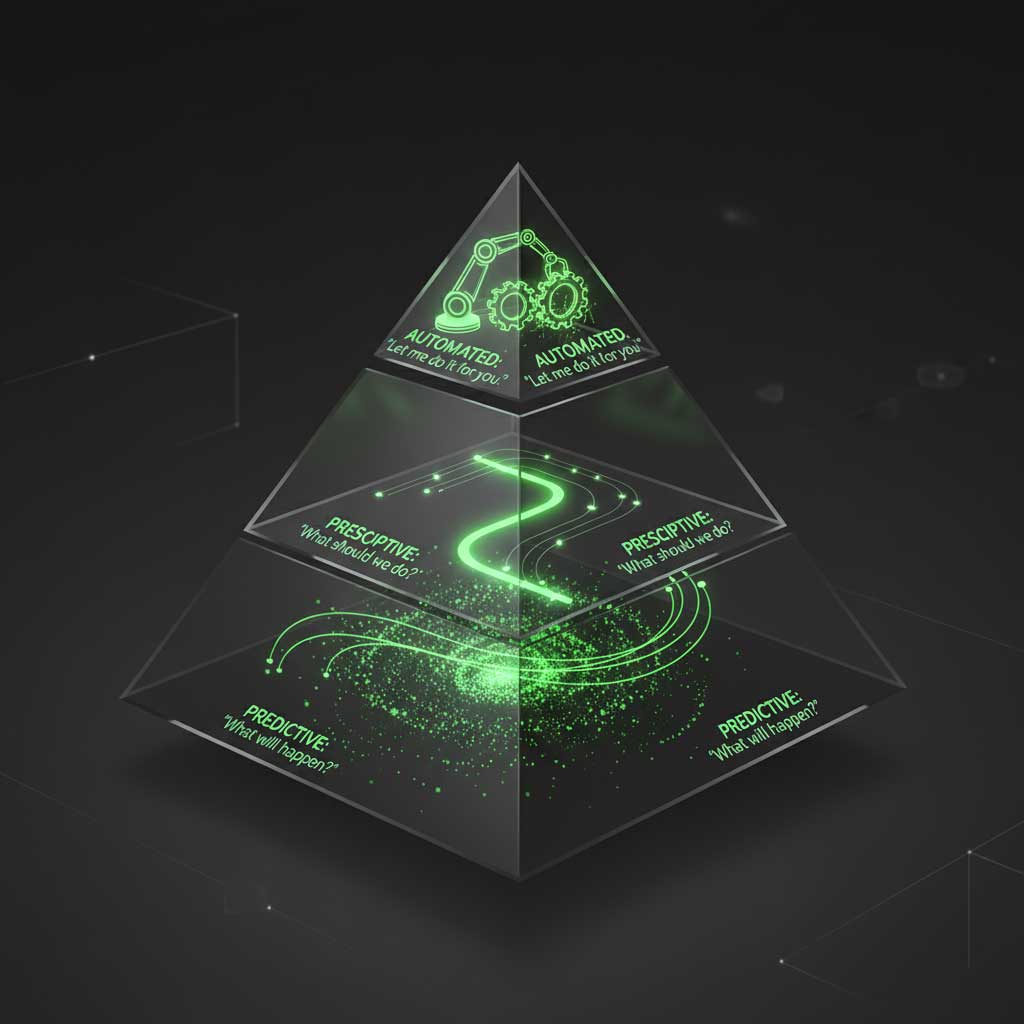
What are the 4 types of data analytics?

The four types are Descriptive (what happened), Diagnostic (why it happened), Predictive (what is likely to happen next), and Prescriptive (what should we do about it). Operational analytics is primarily focused on leveraging predictive and prescriptive analytics.
Can I do operational analytics without a data warehouse?

While technically possible, it’s not scalable or trustworthy. Without a central data warehouse as a “single source of truth,” you’ll be operating with conflicting and incomplete data, leading to inconsistent actions.
How does AI enhance operational analytics?

AI in analytics acts as the intelligence layer. It builds the predictive models (like lead scoring or churn prediction) that are then fed into operational tools via Reverse ETL to trigger smart, automated actions.
Is operations analytics a good career path?

Yes, is operations analytics a good career is a common question, and the answer is definitively yes. Roles like Analytics Engineer and Data Activation Specialist are some of the most in-demand and highly compensated roles in the modern tech landscape.
What is a “Composable CDP” and how does it relate to this?
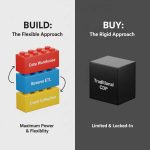
A Composable CDP is a modern approach where instead of buying a monolithic Customer Data Platform, you build your own using best-in-class tools: a data warehouse, an event collection tool, and a Reverse ETL platform. This approach, powered by operational analytics, is more flexible and powerful.
How do I get started with operational analytics on a small budget?
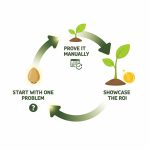
Start with the business problem, not the tech. Identify one process that is inefficient. Often, you can start by manually exporting data and importing it into a tool to prove the concept before investing in a fully automated solution.
What is the biggest challenge when implementing operational analytics?

Beyond data quality, the biggest challenge is cultural. It requires breaking down silos between data teams and business teams and fostering a collaborative environment where data professionals are embedded with business units to solve their real-world problems.
What is the ultimate goal of operational data analytics?
The ultimate goal is to create a business that is not just data-driven, but data-activated. It’s to close the “insight-to-action gap” so completely that intelligent, data-informed decisions become an automatic part of every single business process.